
We are interested in how Binance Coin (BNB) token burns have historically affected the price of the cryptocurrency, so we took a look at some charts and data.
Binance Coin Token Burns: Each Quarter, Binance uses 20% of its profits to buyback and burn BNB tokens. This process continues until half (50%) of the total BNB supply (100 million) has been burned.
The first token burn was announced on the 15th of October 2017, with the burn itself being carried out on the 18th of the same month. This pattern has been consistent throughout the three token burns to date, leaving us to assume that token burns will proceed on the following schedule…
Binance Coin (BNB) Burn Dates, Past and Future
Note: It is assumed that Burn Announcements will take place three days prior to the burn dates (i.e. on the 15th of each burn month).
2017: 18 October
2018: 18 January; 18 April; 18 July; 18 October
2019: 18 January; 18 April; 18 July; 18 October
… (until 50% of BNB burned)
How Did Past Burns Affect Price?
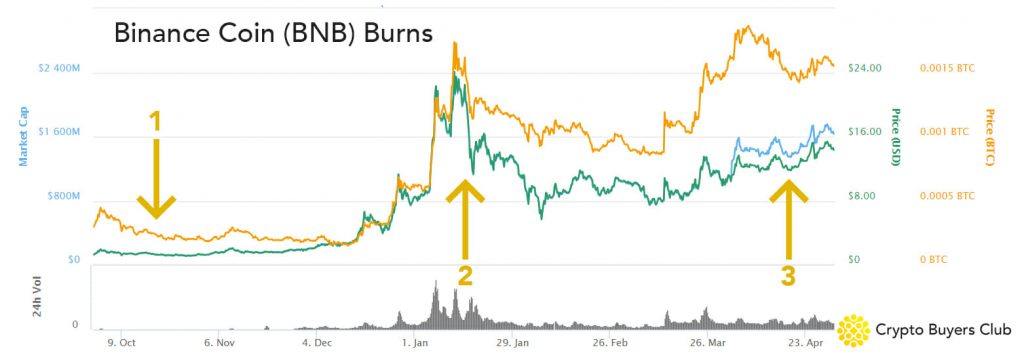
Take a look at the below charts, which depict the BNB price and volume around the three burns.
The First BNB Burn took place on the 18th of October, 2017.

Around the time of the first burn, BNB trading volume was very low relative to today with only around $2 million being traded on the 18th October. When we compare this with more recent trading volume, which regularly exceeds $100 million, it seems that little inference can be made from the results of the first burn.
The Second Token Burn occurred on January the 18th, 2018.
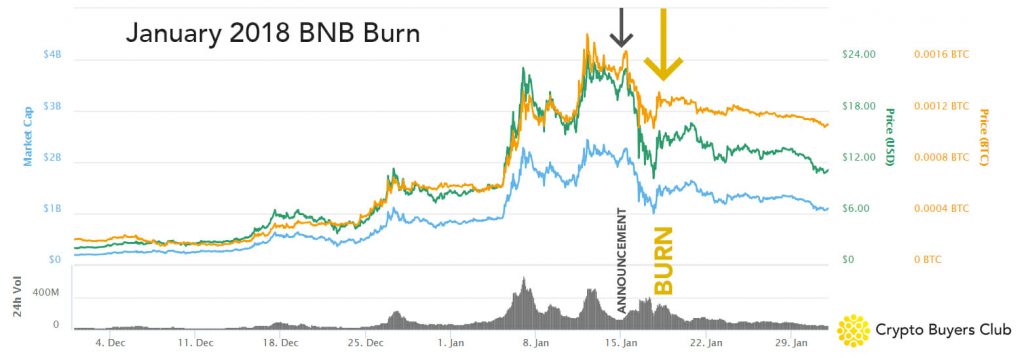
Trading volumes around this burn were enormous, exceeding $400 million 24hr volume in the days and weeks before the announcement. We also see a clear price build-up before the Burn announcement and execution, with the price dropping significantly following the announcement on the 15th of January.
Following the Burn itself, the price steadily declined for the rest of the month, however it is important to note that the entire crypto market has taken a downturn since this period, with BNB faring far better than most.
The Third Binance Coin Burn was executed on the 18th April, 2018.

As with the second Burn, there appears to be an acute price decrease following the announcement of the burn on the 15th of April, however following the burn itself we actually see the price rise.
Let’s Zoom Out a Little…
If we step back a little, and look at a longer-term chart, we see that despite the acute price movements, BNB has experienced impressive growth. Around the time of the second Burn, in January 2018, BNB experienced a large dip, however – as aforementioned – so did the entire cryptocurrency market.
Take a look at this chart to begin thinking about whether the BNB burns are creating important market moves:
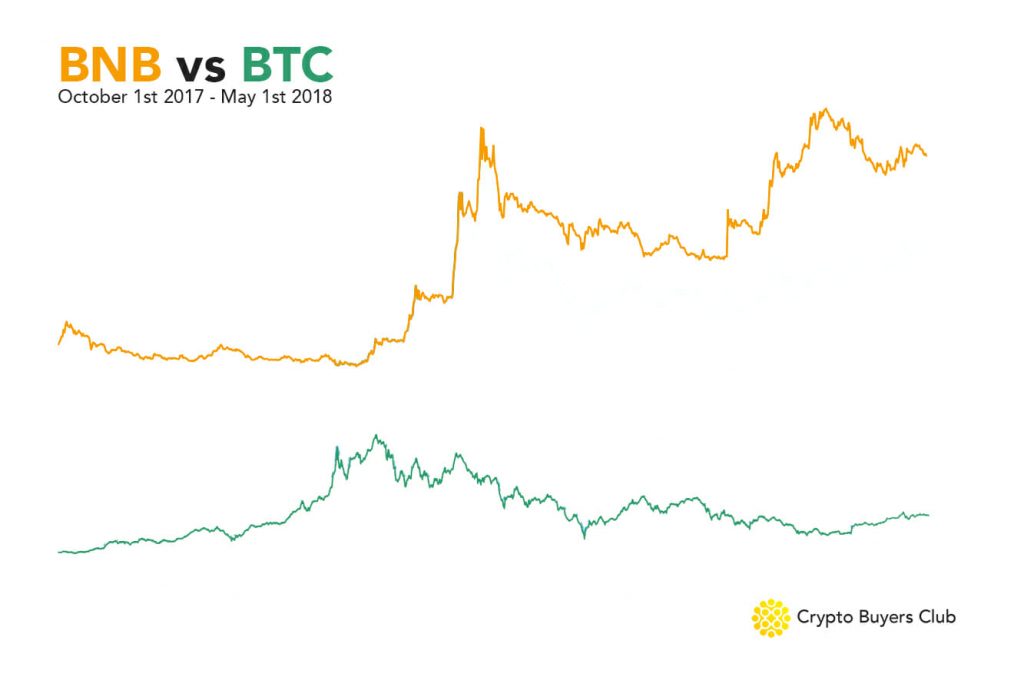
Another way to get a broader perspective on Binance Coin is to compare its performance to Bitcoin.
When we do so, we can see that BNB has experienced extraordinary growth vis-a-vis BTC.
Concluding Remarks
We have provided you with the above charts to help your analysis of Binance Coin (BNB). It should, hopefully, go without saying that past performance is a terrible way to predict future success; and nothing we share here or elsewhere is investment advice.
Nonetheless, we think the more macro, ‘zoomed-out’, view of Binance Coin looks healthy. This is most likely because Binance is an incredibly profitable cryptocurrency exchange, with exciting plans for the future. Compare this to many cryptocurrencies that have no working product, and it’s easy to see why investors are enjoying success with BNB in an otherwise bearish market.
Let us know what you think in the comments below…


