
Today, we take a look back at analysis we conducted and published in summer 2018.
While technical analysis of cryptocurrencies is often a fool’s errand, and past performance is no guarantee of future results, there are certain catalsysts and events that appear to (at leats somewhat) reliably influence the price of tokens.
Recap: Token and BNB Burns
Token burns are one of the most fundamental elements of a token’s economics (or, ‘tokenomics’).
Reminder: a token burn is where a number of tokens are permanently removed from circulation, thus reducing the overall supply.
In the case of Binance Coin (BNB), token burns are significant and will continue until 50% of the total BNB supply (100 million) has been burned.
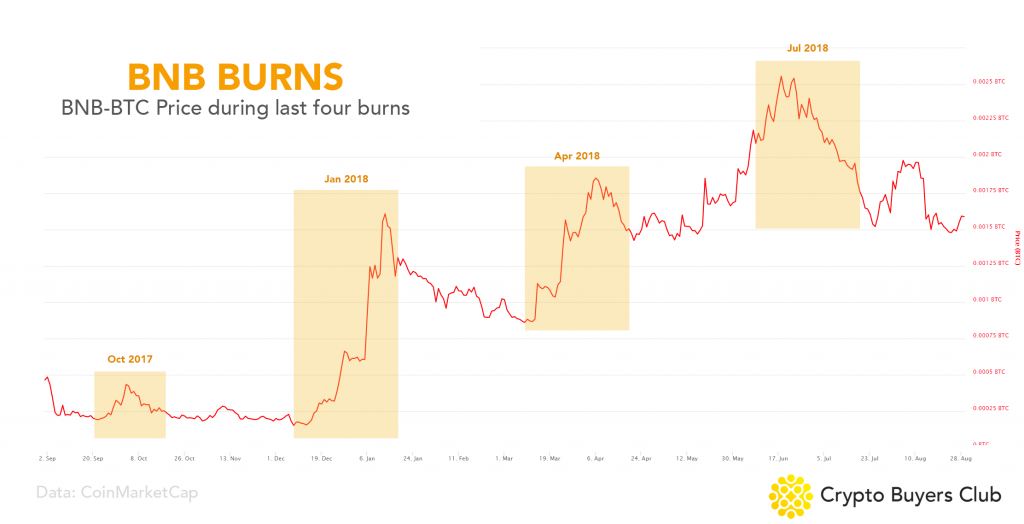
The first BNB token burn took place on 18th October 2017, when trading volume was relatively low.
At the end of 2021, Binance announced a new protocol for the quartlery BNB burn: Auto-Burn. The new methodology decouples the Burn mathematics from revenues generated on Binance’s centralised exchange and instead uses a transparent formula which bases the burn quantity on the price of BNB in a given quarter.
The first Auto-Burn was carried out in late January 2022, removing 1.7 million BNB from circulation.
Spotting a Trend in 2017
Back in 2017, we identified a nascent trend in Binance Coin’s price movement. We began tracking it and seeking to explain it through key metrics, and ultimately decided that the BNB Burn schedule was the most compelling driver aside from Binance exchange’s growth.
No inferences could be made from the inaugural October 2017 BNB burn. Volume was insignificant ($2m traded on the day itself) and there was little discourse around the event.
By the time of the second BNB burn in January 2018, however, things had really picked up. BNB saw $400m in daily volume in the days and weeks leading up to the announcement on January 18th, with clear price build-up prior. Following the Burn announcement on the 15th of January, the price dropped significantly, and steadily declined for the remainder of the month (in the context of a market-wide bleed).
We saw the same pattern in the April 2018 BNB Burn.
Essentially, our analysis showed that BNB token burns are usually preceded by a period of significant price increase, followed by a sharp sell-off and price decrease in the days immediately before and after the burn date.
Read an outline of our observations here.
Reviewing our Analysis in 2018
In August 2018 we decided to check whether the trend we identified was holding.
July 2018’s burn, which happened shortly after we published our initial analysis, didn’t hold true to trend. While there was a clear run-up, the sell-off happened earlier than we would have expected.
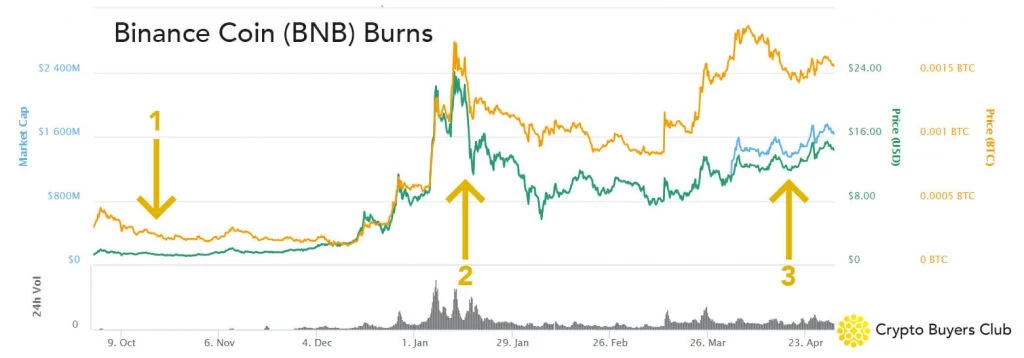
Zooming Out
Our advice to those who get hung up on technicals is always to Zoom Out.
When zooming out in the case of BNB’s price action, it was clear back in 2018 that while Burns were driving short-term price action, they were mediated by broader market trends (including Binance exchange’s performance):
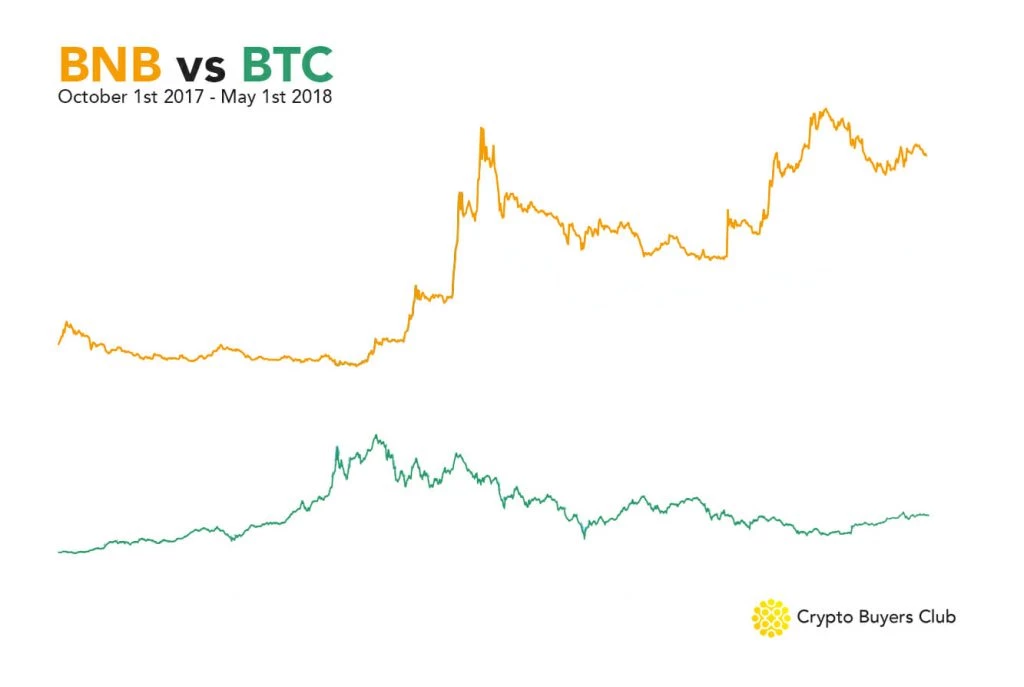
It’s also worth benchmarking a coin’s performance against an established crypto, like Bitcoin. Here, we see that BNB was outperforming BTC throughout the October 2017 – May 2018 period:
Ultimately, we delivered a bullish verdict on Binance Coin (BNB) back in 2018:
Nonetheless, we think the more macro, ‘zoomed-out’, view of Binance Coin looks healthy. This is most likely because Binance is an incredibly profitable cryptocurrency exchange, with exciting plans for the future. Compare this to many cryptocurrencies that have no working product, and it’s easy to see why investors are enjoying success with BNB in an otherwise bearish market.
BNB closed trading at $16.70 on the day we published this analysis, and $1.53 back in October 2017 when we began watching this trend.
Today, it’s trading at $395.26, up 2,267% since our analysis: a 24x return.